

How to Use Content Pillars
My system to track and quantify your brand or creator social media data.

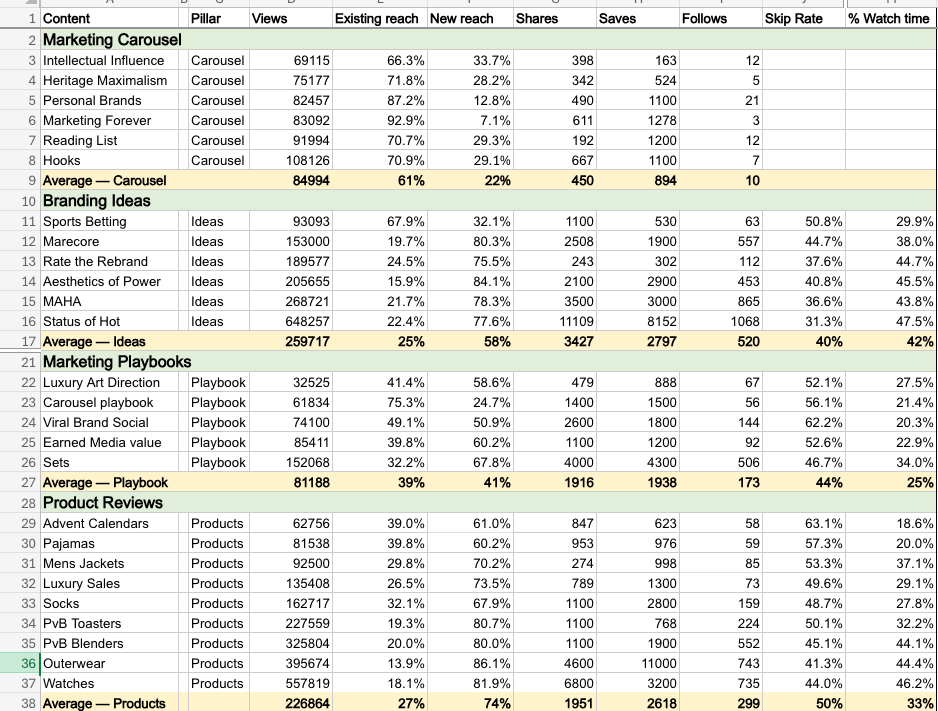
I shared this Excel screenshot of how I look at my analytics on social media the other week and it got quite a bit of interest in social media tracking. Let’s break down the pillars system I use (and how I’m doing analysis now using Agent Mode in Excel).
The Pillar system
The concept here is that at any given time, a creator or brand have 3-5 content ‘pillars’ that you are running and evaluating monthly.
For example, for a month you might have:
Photoshoot carousels
Product explainer videos
Relatable skits
Asmr unboxings
At the end of the month, you evaluate the posts for each pillar, and will probably see some of them are working and some of them are falling off.
If a pillar is falling off (happens all the time), the first thing to do is elevate it, and decide what you want to do to improve it, and pick from one of the below.
Better hooks
Change the production value
Hit the 2x - double the value, or double the entertainment
If this isn’t working, you can cycle out the pillar for something new. Just because a pillar stops working doesn’t mean forget about it forever... Algorithms change and that means certain formats or ideas come in and out.
The formula of a pillar
A. A concept (’Packaging’ ‘brand breakdowns’ ‘fitness tips’ ‘building the business’)
+
B. 1-2 formats (Green screen, carousels, challenges, memes etc.)
To make the system work, make multiple content pieces per month per pillar and evaluate each month. If you have four pillars doing 5-10 pieces of content a month per… that’s a great way to plan your content calendar.
And it’s worth noting if you look at my analytics above. Pillars have different objectives. I’ve talked about the Content Funnel before, and for instance my Carousel and Marketing Playbooks are middle-of-funnel content. Designed to nurture, not gain new followers.
To analyze this every month, I track the above in Excel, and use their Agent Mode feature to analyze the data (it’s very good).
Template here (fill in your own pillars and stats, adjust any formulas as needed).
Playbook below with prompts.
Agent Mode in Excel Prompts
Social analysis:
Take a look at my social data and help me come up with a roadmap to get to 500K followers. It should take into account my top performing posts and set goals and actions.
Comparison:
Compare content types against each other and standalone over time, I want ___ to be the hero KPI
Another prompt I’ve been using unrelated to social media:
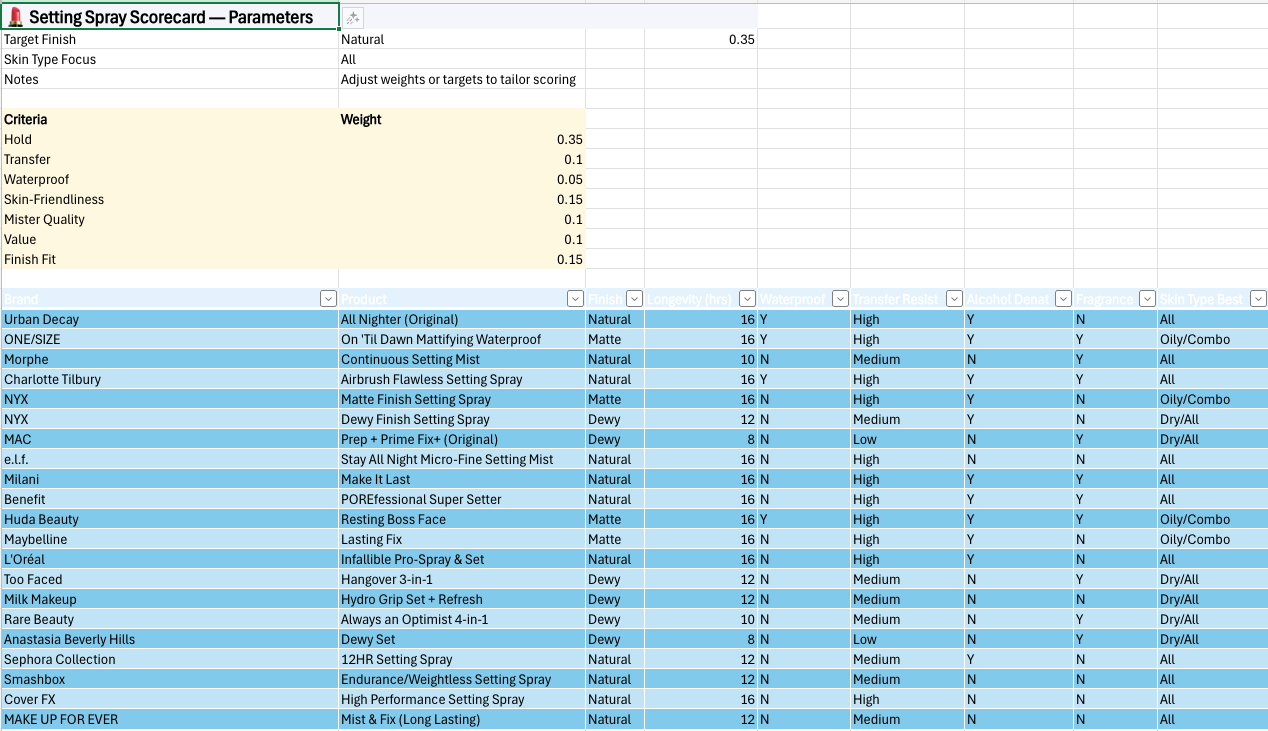
Brand research scorecard:
Create a scorecard for me on the best pots and pans in the industry. I want pros, cons, features, and a logical system for giving them a score based off those features. Search for every brand you can find.
This is an example of what that generates (with far more columns) and you can adjust the weight of criteria to make a system that works for your comparison. It’s pretty wild how useful the data it pulls is.
How to Implement This
If you want to make a difference with your work as a creator or with social media in your org going into next year, here’s how to implement this step by step.
Setup:
Pick 3-5 pillars for your content above. This doesnt mean you can’t run other content, but this should be your core. Your content probably already has some breakouts like this, now this is your opportunity to quantify them and have a process for formally improving, stopping and adding them that follows an analytics-driven strategy.
Monthly Analytics. Fill out the analytics worksheet above.
Monthly strategy. From that data, look above and choose an option for each Pillar on how you plan to improve, or if you’re discontinuing, and mark it for the next month review.
Create a Recap. Review with your team, or send to your boss/clients. You can generate this data with Agent Mode above by asking.
This month, we ran these four pillars on social media
Pillar 1 - X posts, total saves, shares, follows, views - % views change MoM
Pillar 2 - X posts, total saves, shares, views - % views change MoM
Pillar 3 - X posts, total saves, shares, views - % views change MoM
Pillar 4 - X posts, total saves, shares, views - % views change MoM
Following up on last month, we tried to improve ____ by ____ and it (worked/failed)
Because of this, we are going to:
Stay steady with ____
Improve ____ by trying ____ (hook, production change, or double up)
Remove ___ and replace with _____
Having this on hand, or proactively sending it monthly to stakeholders, gives you the ammunition to be in charge of strategy and actively discuss it based on metrics.
This format is a life saver to prevent a lot of unnecessary convos that aren’t rooted in data and real testing.
Monthly is the right cadence because you need to do something at least 4x to see if it works, and content sometimes takes time to resonate.
Start by doing this overall, then begin to split this by social network when you see things working differently.
The best content strategists will begin to split this off by TikTok, Instagram, Shorts, LinkedIn etc, and it means more coordination and more content, having to figure out what can work in multiple places, but lead to more success long term.
I’ve run this, onboarded dozens of brands now, and we run it inside of Cut30 with now thousands of creators. It’s a system that works, and I would highly encourage you to try going into the new year.
Best,
Oren